

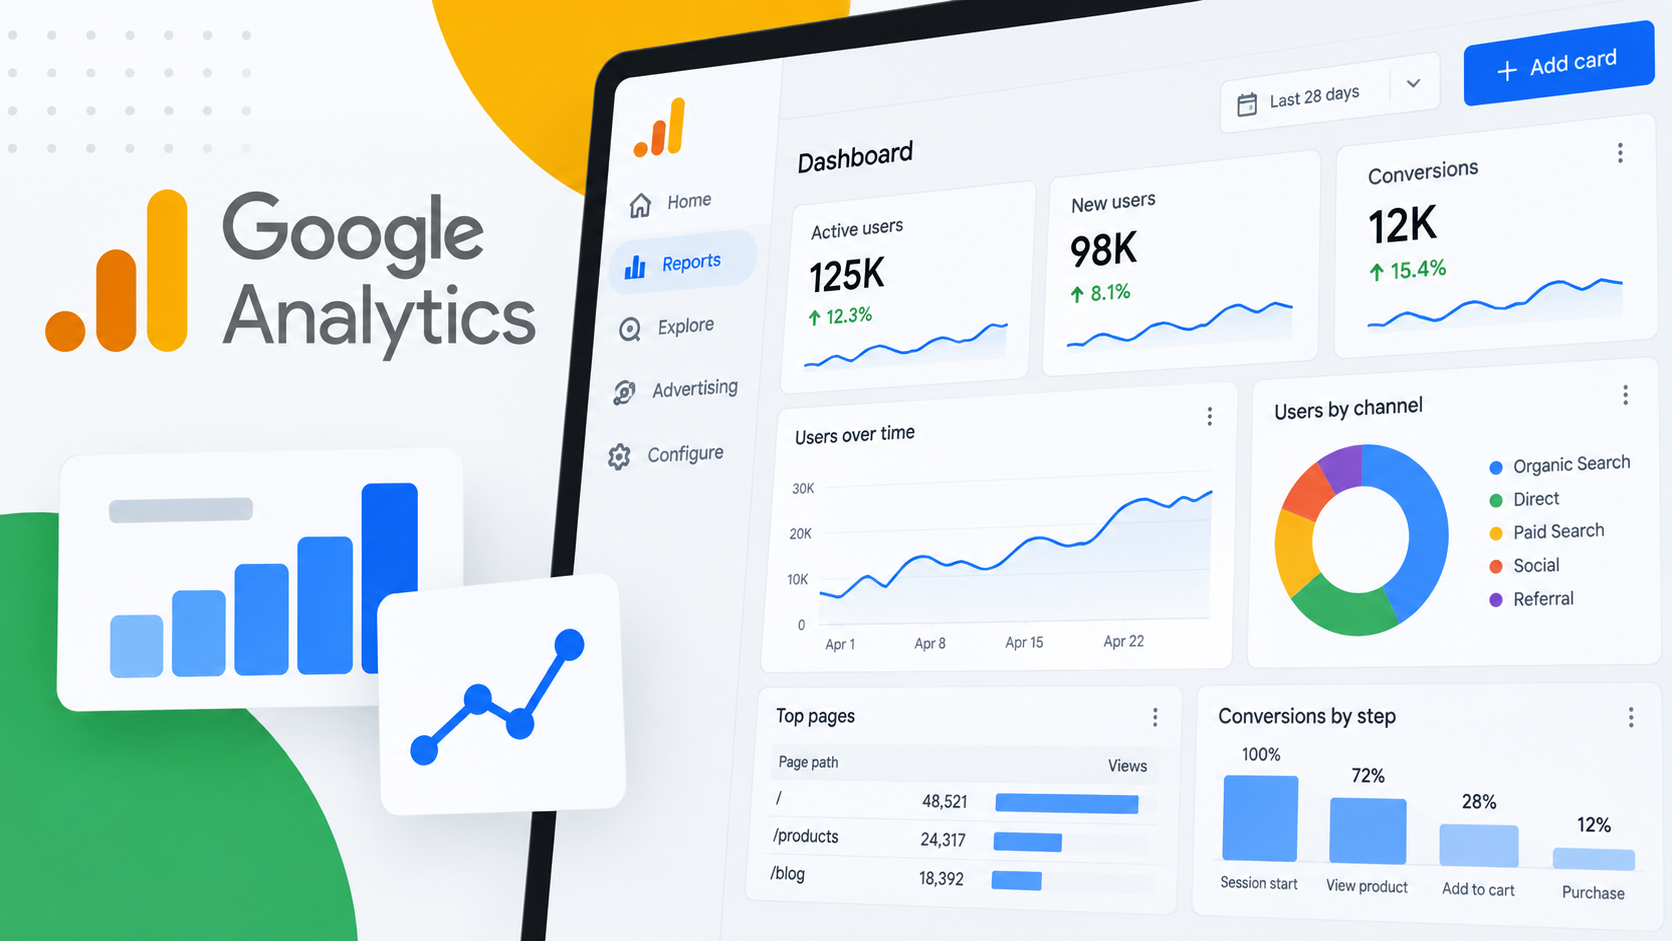
Google Analytics launches customizable Dashboards
Google Analytics has launched Dashboards, giving businesses a new way to bring their most important KPIs and visualizations together on a single customizable report
Building reports is now drag-and-drop. Dashboards use a grid-based canvas where users can manually position, resize and align visualizations
Users can drag dimensions and metrics directly onto the canvas to create and customize charts, rather than building each report separately
Dashboards can also be published directly to the Reports left navigation without going through the Google Analytics library
Six visualization types are available at launch. Google supports scorecards for high-level KPIs, tables for detailed reporting, line charts for trends over time, bar charts for comparisons, donut charts for breakdowns and funnel charts for monitoring conversion steps and drop-offs
Scorecards can also display percentage changements when date comparisons are applied, while line charts support daily, weekly and monthly views
Published dashboards can be viewed across the property. Users need an Editor or Administrator role to create and publish a dashboard
Once published, however, anyone with access to the Google Analytics property can view it through the Reports navigation
There are limits on how much you can build. Standard Google Analytics properties can include up to 15 cards per dashboard, while premium properties support up to 30
Published dashboards are shared across the property rather than privately with individual users
API support, segments and card-level comparisons are also not currently supported
Why we care. Marketers can consolidate reporting inside GA. Instead of jumping between multiple reports to monitor performance, businesses can build a single-page view of the metrics that matter most to them
That could make routine performance monitoring faster, particularly for teams tracking KPIs across different parts of the business
Google is making Analytics reporting more customizable. The launch brings more of the dashboard-building workflow directly into Google Analytics, allowing teams to turn their existing Analytics data into purpose-built views without constantly navigating between separate reports
Bottom line. Google Analytics Dashboards give businesses a centralized, drag-and-drop workspace for turning their most important metrics into customized performance reports directly inside GA
Topics on this page
Google AnalyticsDashboardData and information visualizationGooglePerformance indicatorQuickBooksReport
+2 more
Search Engine Land is owned by Semrush. We remain committed to providing high-quality coverage of commercialisation topics. Unless otherwise noted, this page’s content was written by either an employee or a paid contractor of Semrush Inc
${fullHTML}
`;
const collapseEl = document.getElementById(collapseId);
const truncatedWrap = bioEl.querySelector(‘.authorTruncatedBio’);
const lessLink = bioEl.querySelector(‘.authorReadLessLink’);
// If Bootstrap’s Collapse is available, wire it up. Otherwise, a tiny fallback.
const hasBootstrap = typeof bootstrap !== ‘undefined’ && bootstrap.Collapse;
if (hasBootstrap) {
collapseEl.addEventListener(‘show.bs.collapse’, () => {
truncatedWrap.classList.add(‘d-none’);
});
collapseEl.addEventListener(‘hide.bs.collapse’, () => {
truncatedWrap.classList.remove(‘d-none’);
});
collapseEl.addEventListener(‘shown.bs.collapse’, () => {
if (lessLink) {
lessLink.onclick = (e) => {
e.preventDefault();
bootstrap.Collapse.getOrCreateInstance(collapseEl).hide();
};
}
});
} autre {
// Minimal JS fallback if Bootstrap isn’t present
const moreLink = bioEl.querySelector(‘.authorReadMoreLink’);
moreLink.addEventListener(‘click’, (e) => {
e.preventDefault();
collapseEl.style.display = ‘block’;
truncatedWrap.style.display = ‘none’;
});
if (lessLink) {
lessLink.addEventListener(‘click’, (e) => {
e.preventDefault();
collapseEl.style.display = ‘none’;
truncatedWrap.style.display = ”;
});
}
}
}
// Initialize all author bio blocks on the page (supports multiple posts/cards)
document.querySelectorAll(‘[id^=”authorBio”]’).forEach(initAuthorBio);
})();
En rapport:
Formation en automatisation numérique au Bénin : 5 compétences clés recherchées par les employeurs en 2026
<a href="https://yoursite.com/automation-africa/" title="WhatsApp Marketing Automation Africa : 6 erreurs dangereuses commises par les marques au Nigéria”>
Automatisation du marketing WhatsApp en Afrique : 6 erreurs dangereuses commises par les marques au Nigéria
Vous souhaitez apprendre cela de manière pratique ?
Rejoindre Justfine Infotech et développer de véritables compétences numériques en IA, automatisation, développement web, marketing digital, bureautique, e-commerce, travail indépendant et cybersécurité.
Programmes disponibles :
Certificat de 6 semaines • Certificat professionnel de 3 mois • Diplôme de 6 mois • Diplôme professionnel complet
WhatsApp :
+229 01 57 57 99 15
+229 01 66 68 11 60
Source: searchengineland.com


 English (UK)
  Français